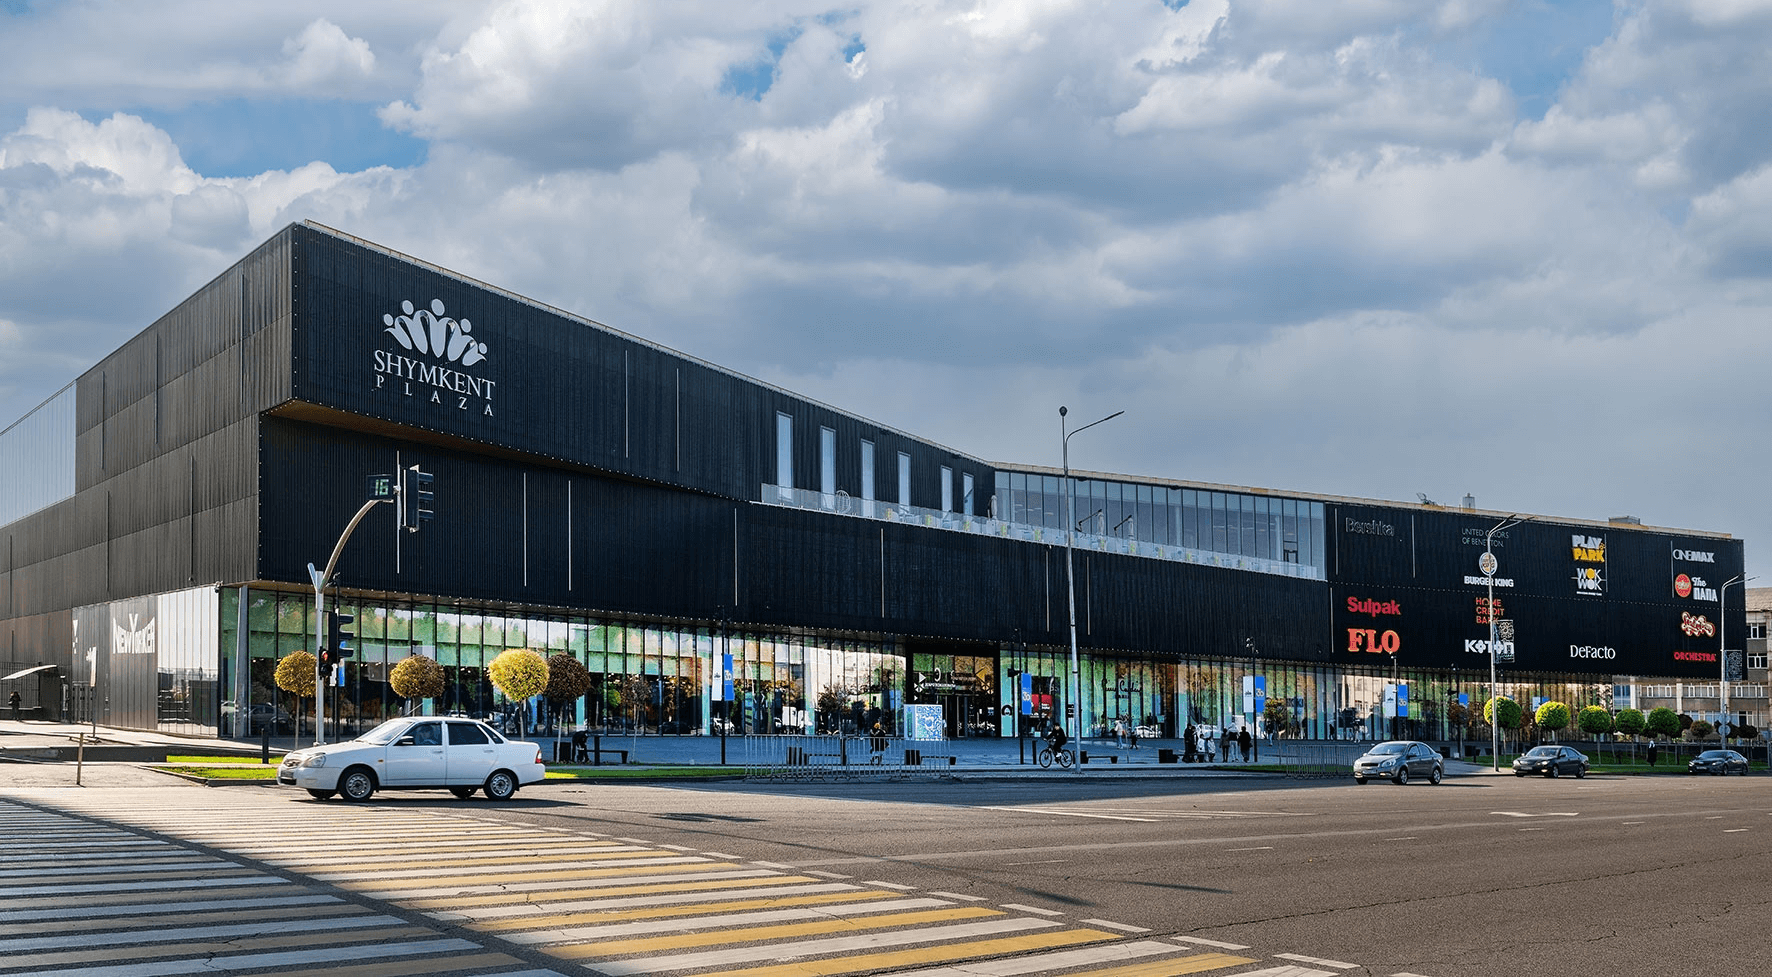
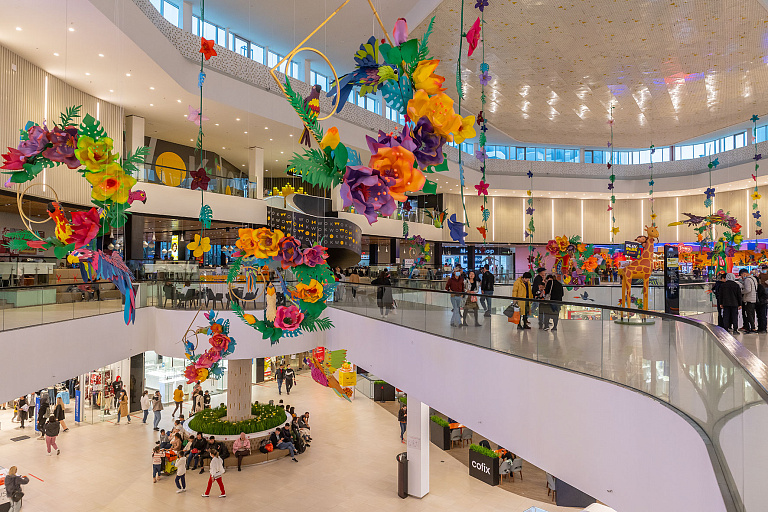
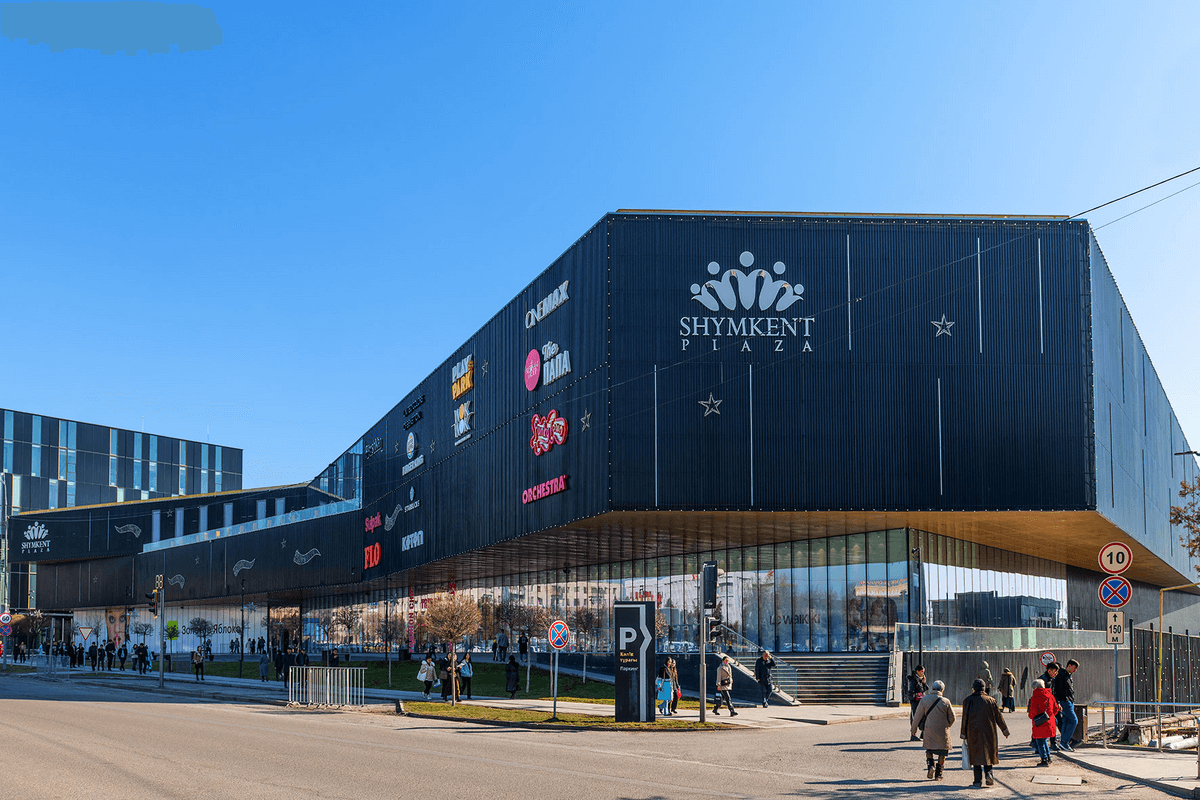
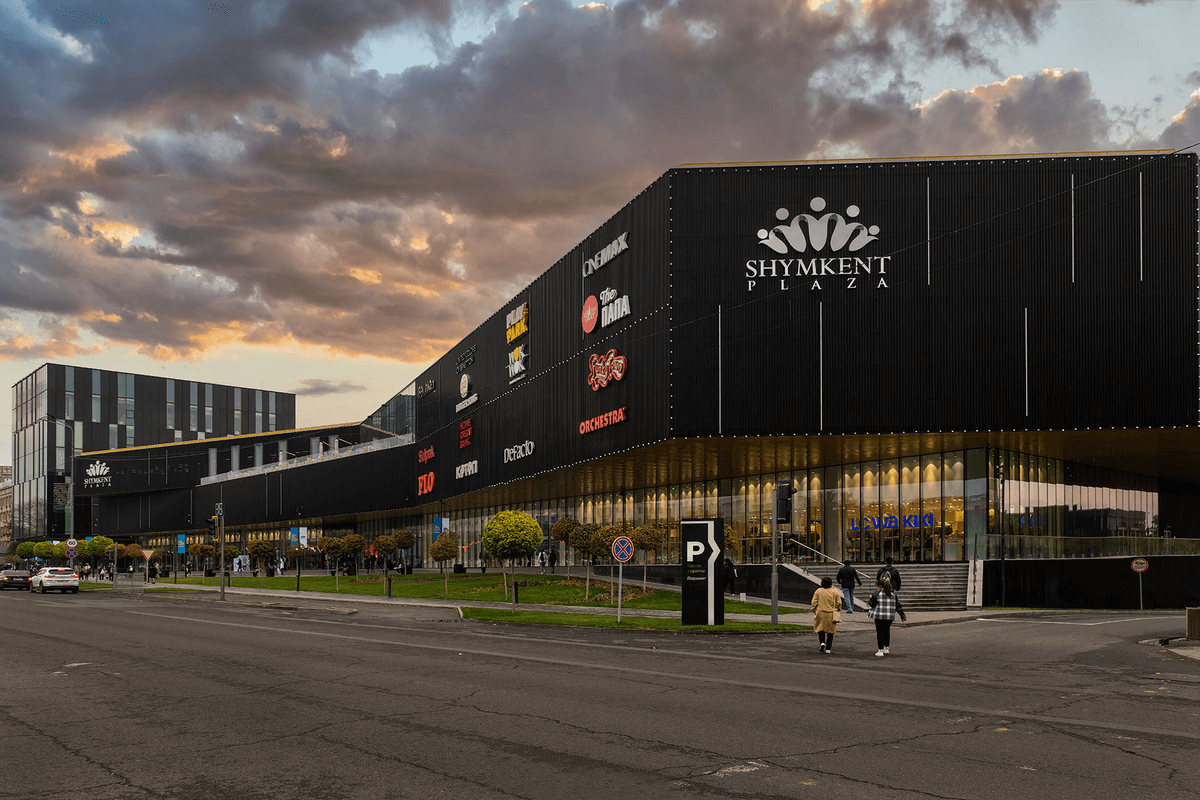
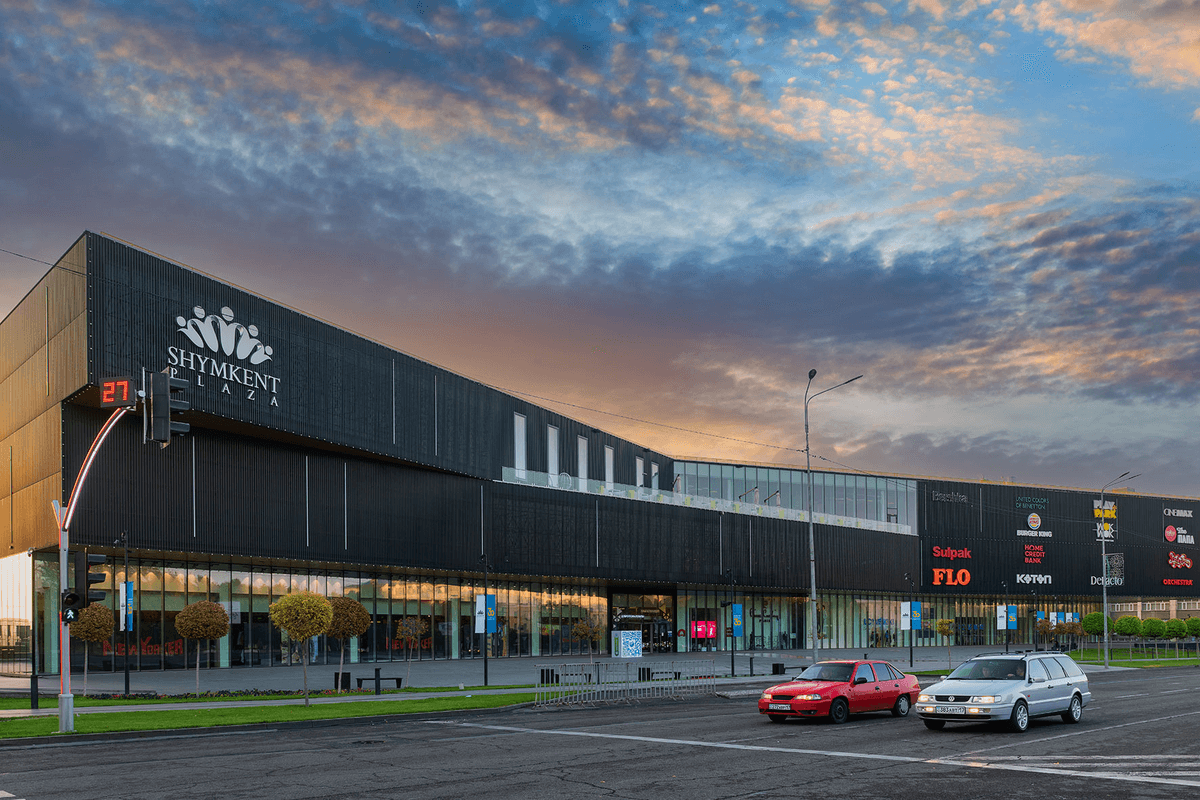
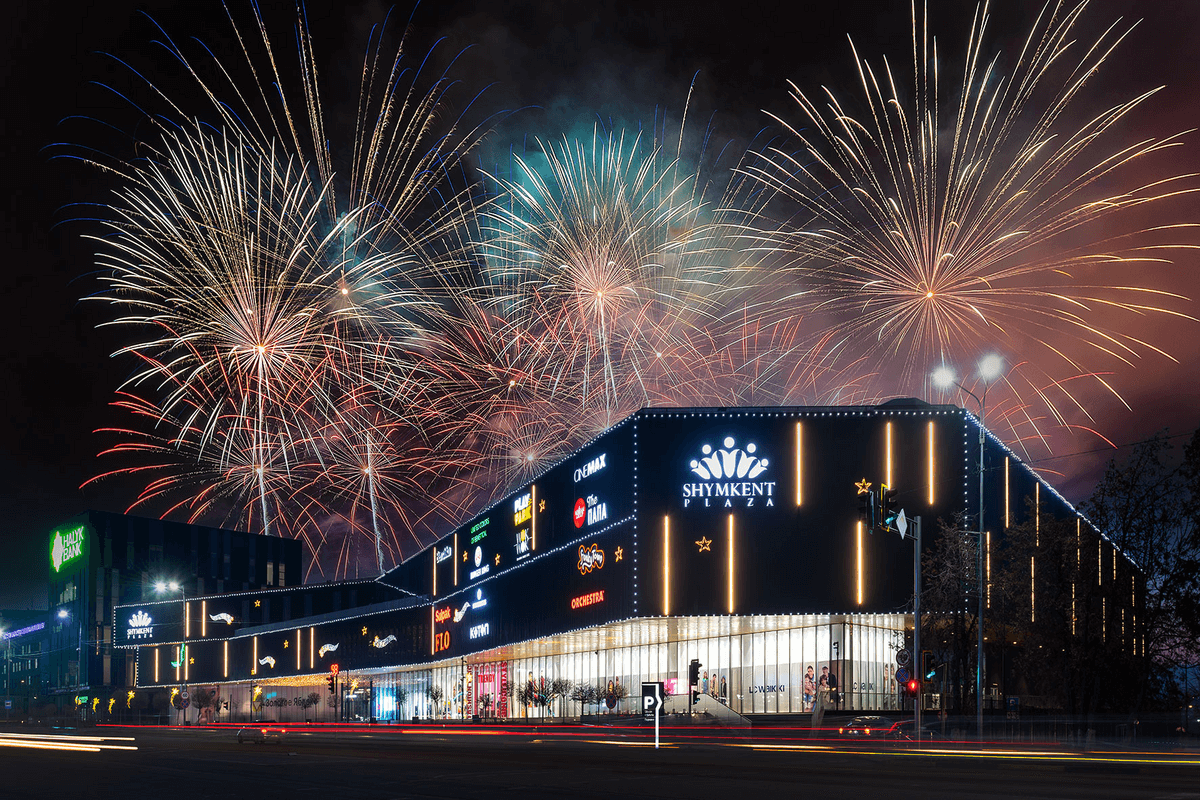
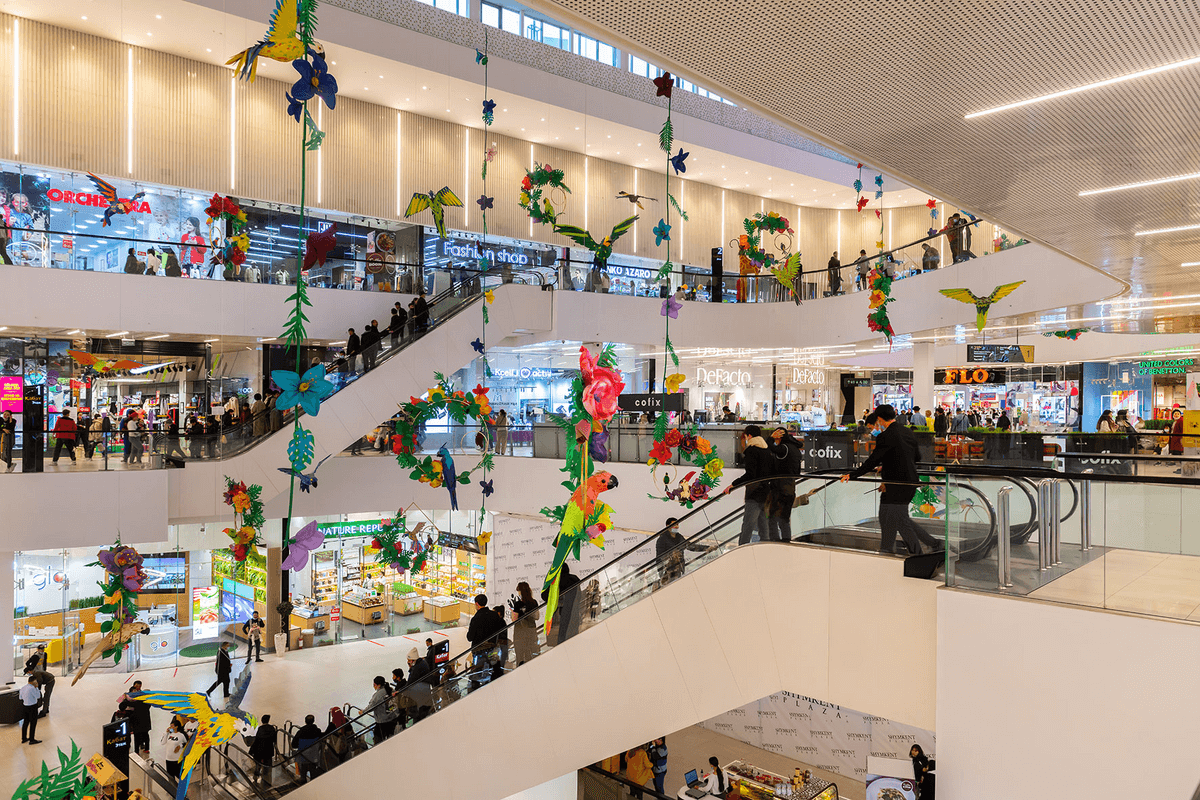
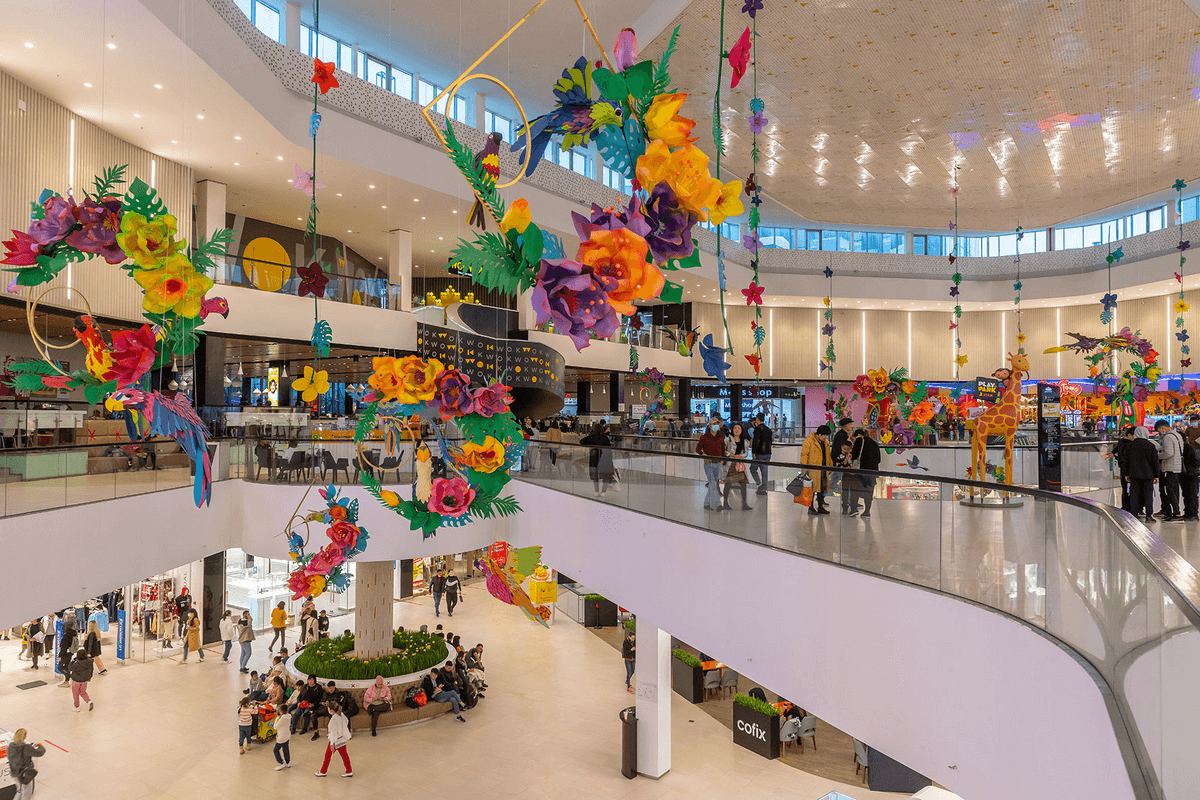
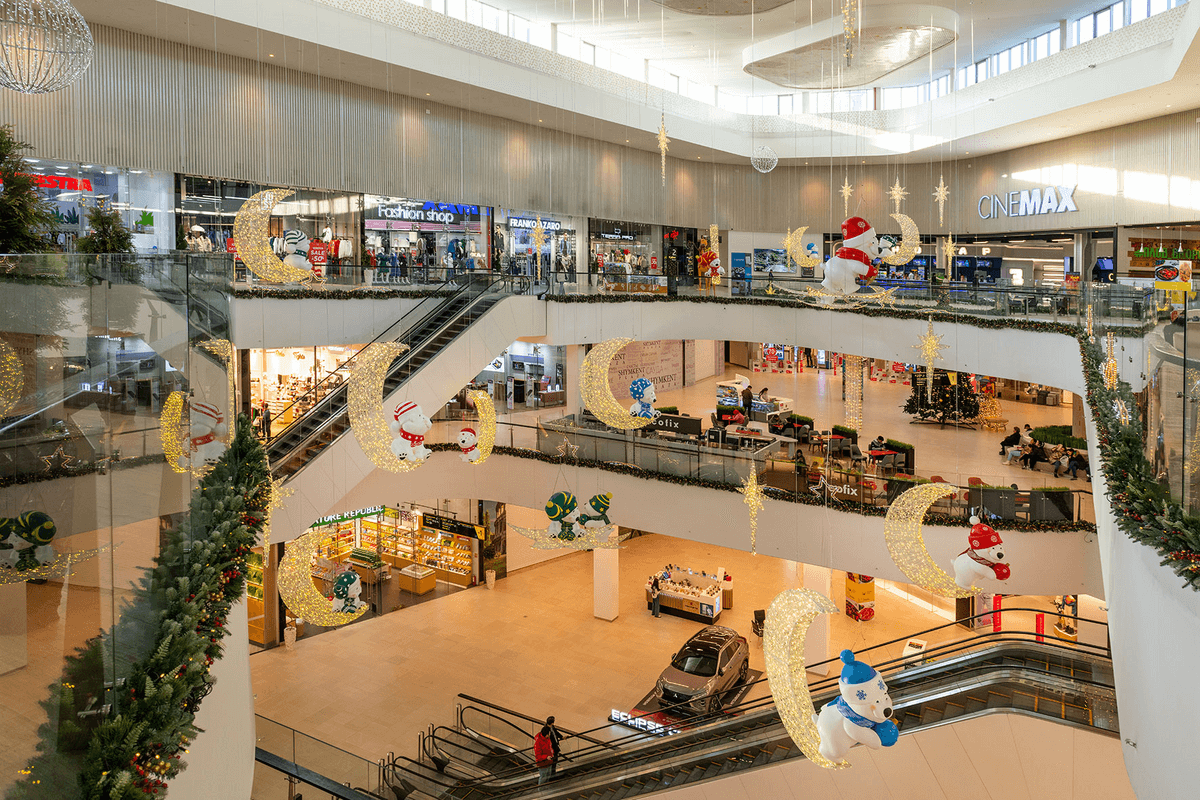
SHYMKENT PLAZA
shymkentplaza.kzis a modern “A” class shopping and entertainment center, created for comfortable shopping and pleasant leisure. The largest shopping center in Shymkent.
The development of the architectural concept was carried out by the famous British company Benoy, known for the projects Ferrari World in Abu Dhabi, Elements in Singapore, Westfield shopping center in London and many others.
The object in numbers
-
48 400 m2
Total area
-
23 800 m2
Retail area
-
70
Tenants
-
5 600 000
Annual attendance
-
$75 000 000
Annual turnover
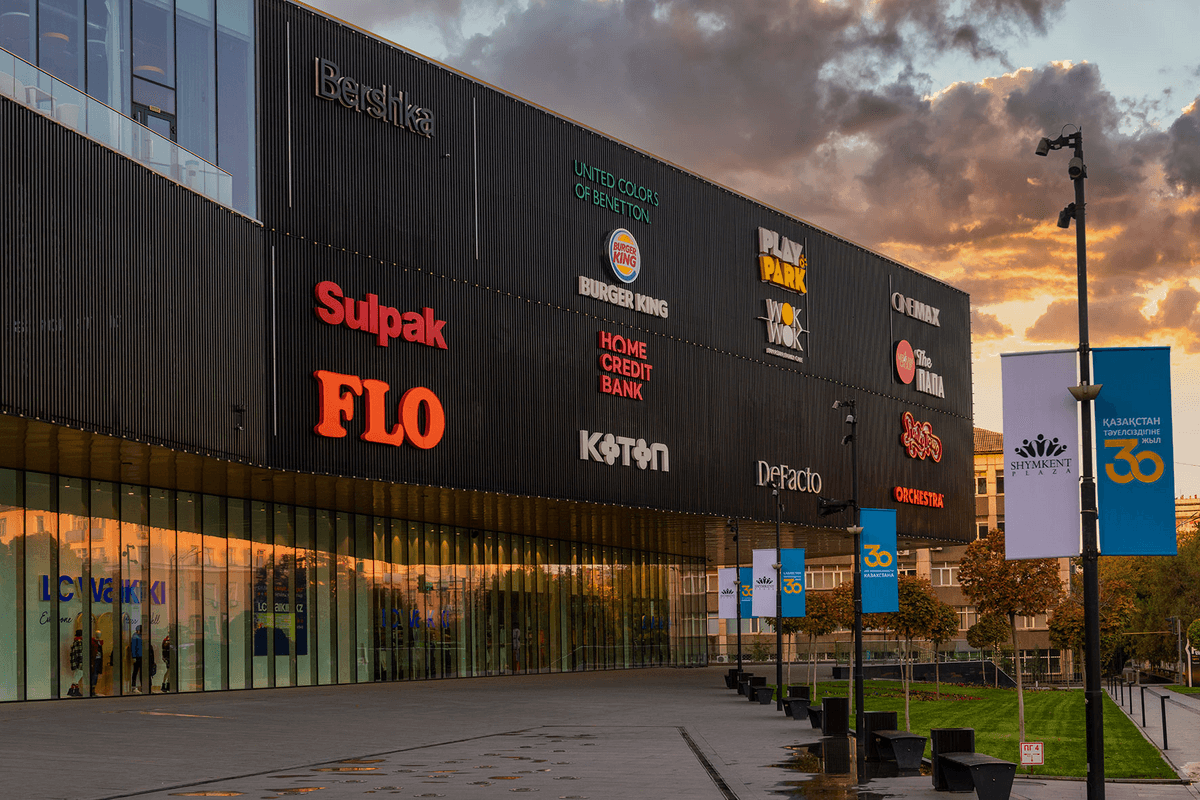
Key tenants
-
Bershka
-
LC Waikiki
-
KOTON
-
Sulpak
-
Colin's
-
KFC
-
Cinemax
-
Tommy Hilfiger
-
LiNing
-
Золотое яблоко
-
Calvin Klein
-
Adidas
-
Starbucks
-
Levi’s
-
Lacoste
-
Under Armour
-
Nike
-
Coffee Boom
-
Burger King
-
Funky Town
-
Orchestra
Financial performance
Shymkent Plaza's financial performance
- Income
- Expenses
- Income Estimate
- Expenses Estimate
 NOI
NOI NOI Estimate
| Period | 2021 | 2022 | 2023 | 2024 | 2025 | 2026* |
|---|---|---|---|---|---|---|
| Income | $7 178 762 | $7 318 680 | $8 595 836 | $12 264 987 | $12 389 543 | $12 673 252 |
| Expenses | $2 559 994 | $2 444 083 | $2 355 821 | $3 372 785 | $3 348 994 | $3 580 979 |
| NOI | $4 618 768 | $4 874 597 | $6 240 015 | $8 892 203 | $9 040 549 | $9 092 272 |
| NOI margin | 64% | 67% | 73% | 73% | 73% | 72% |
| Opex ratio | 36% | 33% | 27% | 27% | 27% | 28% |
* Forecast
Trade turnover vs Attendance of Shopping
and Entertainment Centers
- Shopping and Entertainment Center turnover
- Attendance of the Shopping and Entertainment Center
| Period | 2021 | 2022 | 2023 | 2024 | 2025 | 2026* |
|---|---|---|---|---|---|---|
| Shopping and Entertainment Center turnover ($) |
$57 187 639 | $49 438 871 | $62 607 809 | $68 619 486 | $75 000 589 | $75 377 440 |
| Attendance of the Shopping and Entertainment Center (person) |
5 289 415 | 5 317 865 | 5 564 192 | 5 589 871 | 5 661 873 | 5 755 919 |
* Forecast
Conversion and average bill of Shopping
and Entertainment Center
- Average check
- Conversion
| Period | 2021 | 2022 | 2023 | 2024 | 2025 | 2026* |
|---|---|---|---|---|---|---|
| Conversion | 62% | 44% | 45% | 50% | 55% | 51% |
| Average |
$17 | $21 | $25 | $25 | $24 | $26 |
* Forecast
Occupancy of Shopping and Entertainment Center
areas and Weighted average rate
- Occupancy of Shopping and Entertainment center areas
- Weighted average rate
| Period | 2021 | 2022 | 2023 | 2024 | 2025 | 2026* |
|---|---|---|---|---|---|---|
| Occupancy of Shopping and Entertainment Center areas |
94% | 92% | 97% | 100% | 100% | 100% |
| Weighted average rate |
$255 | $277 | $344 | $427 | $437 | $449 |
* Forecast
Turnover
per sq.m per month
- Turnover per sq.m per month
| Period | 2021 | 2022 | 2023 | 2024 | 2025 | 2026* |
|---|---|---|---|---|---|---|
| Turnover per sq.m per month ($) |
$221 | $222 | $222 | $237 | $259 | $259 |
* Forecast